Skip to content
GitLab
Projects Groups Snippets
  • /
  • Help
    • Help
    • Support
    • Community forum
    • Submit feedback
    • Contribute to GitLab
  • Sign in / Register
  • ParaView ParaView
  • Project information
    • Project information
    • Activity
    • Labels
    • Members
  • Repository
    • Repository
    • Files
    • Commits
    • Branches
    • Tags
    • Contributors
    • Graph
    • Compare
  • Issues 1,961
    • Issues 1,961
    • List
    • Boards
    • Service Desk
    • Milestones
  • Merge requests 97
    • Merge requests 97
  • CI/CD
    • CI/CD
    • Pipelines
    • Jobs
    • Schedules
  • Deployments
    • Deployments
    • Environments
    • Releases
  • Monitor
    • Monitor
    • Incidents
  • Analytics
    • Analytics
    • Value stream
    • CI/CD
    • Repository
  • Wiki
    • Wiki
  • Snippets
    • Snippets
  • Activity
  • Graph
  • Create a new issue
  • Jobs
  • Commits
  • Issue Boards
Collapse sidebar
  • ParaViewParaView
  • ParaViewParaView
  • Issues
  • #18365
Closed
Open
Issue created Aug 09, 2018 by Cory Quammen@cory.quammenMaintainer

White bands in chart saved via Python script

From https://discourse.paraview.org/t/savescreenshot-resolution-issue-with-plotdata/411

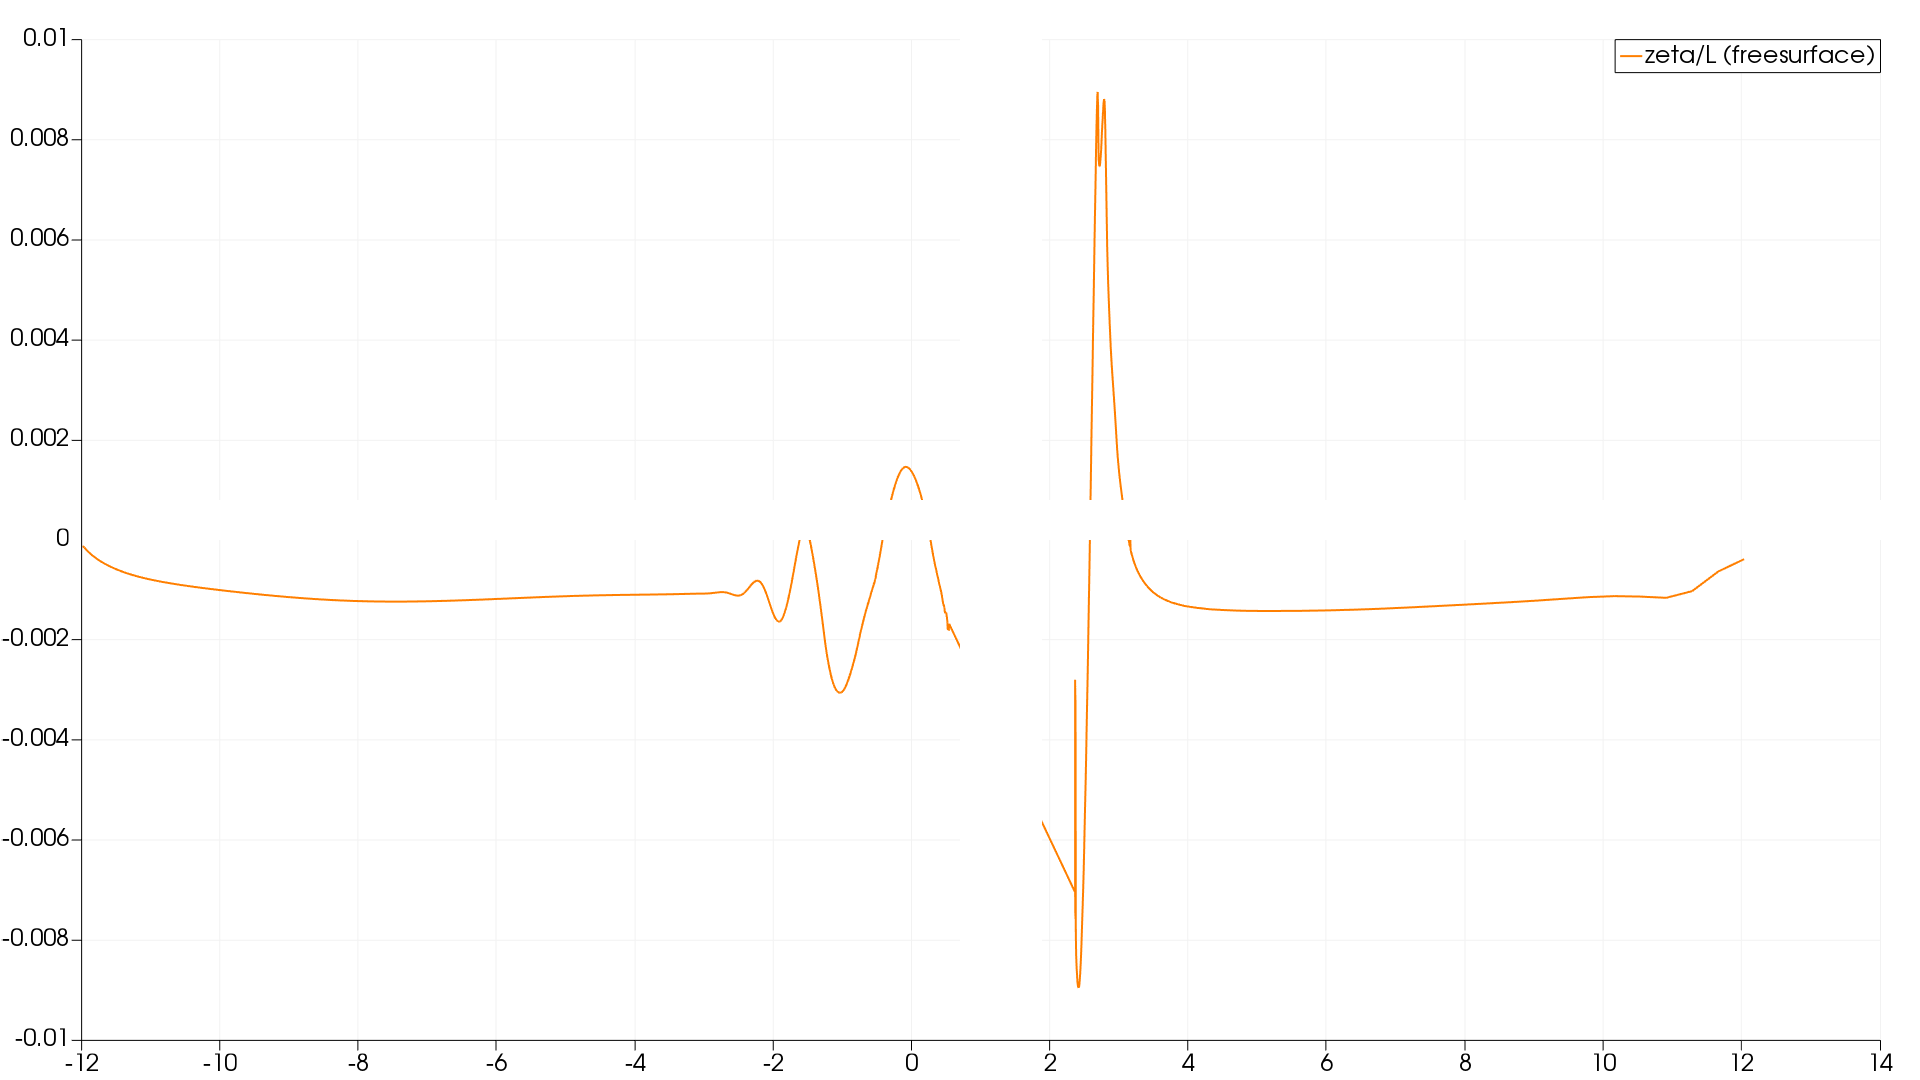
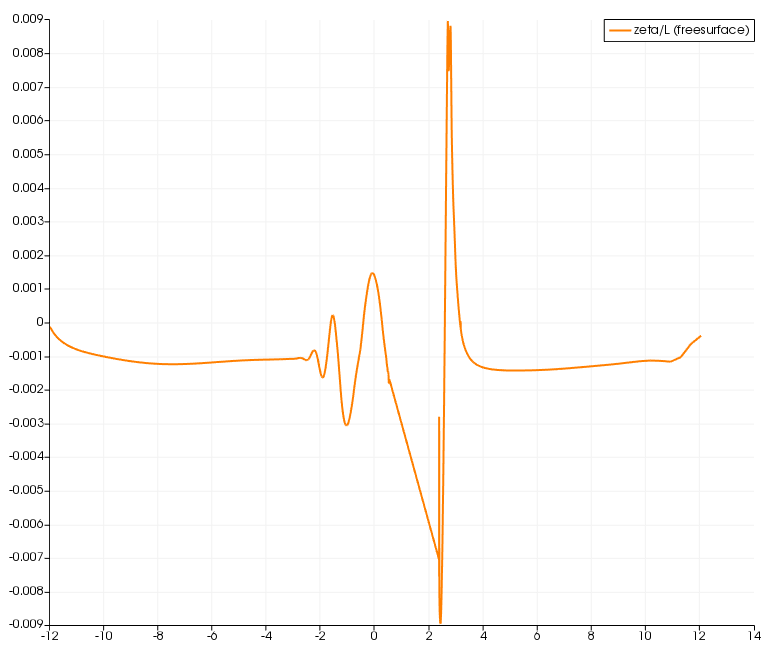
I am using Paraview 5.5.2 Qt5 64 bit on Windows 7 with python scripting and have an issue with SaveScreenshot when I select a output resolution other than the one that is used when I save my actions using the python trace. With the settings as provided by the trace [774x652] I get a nice plot of my PlotData filter in the LineChartView, but I would like to have a higher resolution plot. Therefore, I changed the output resolution to 1920x1080, and get a plot with blank bands in the graph.

Lower resolution image:

Higher resolution image:

To upload designs, you'll need to enable LFS and have an admin enable hashed storage. More information
Assignee
Assign to
Time tracking